
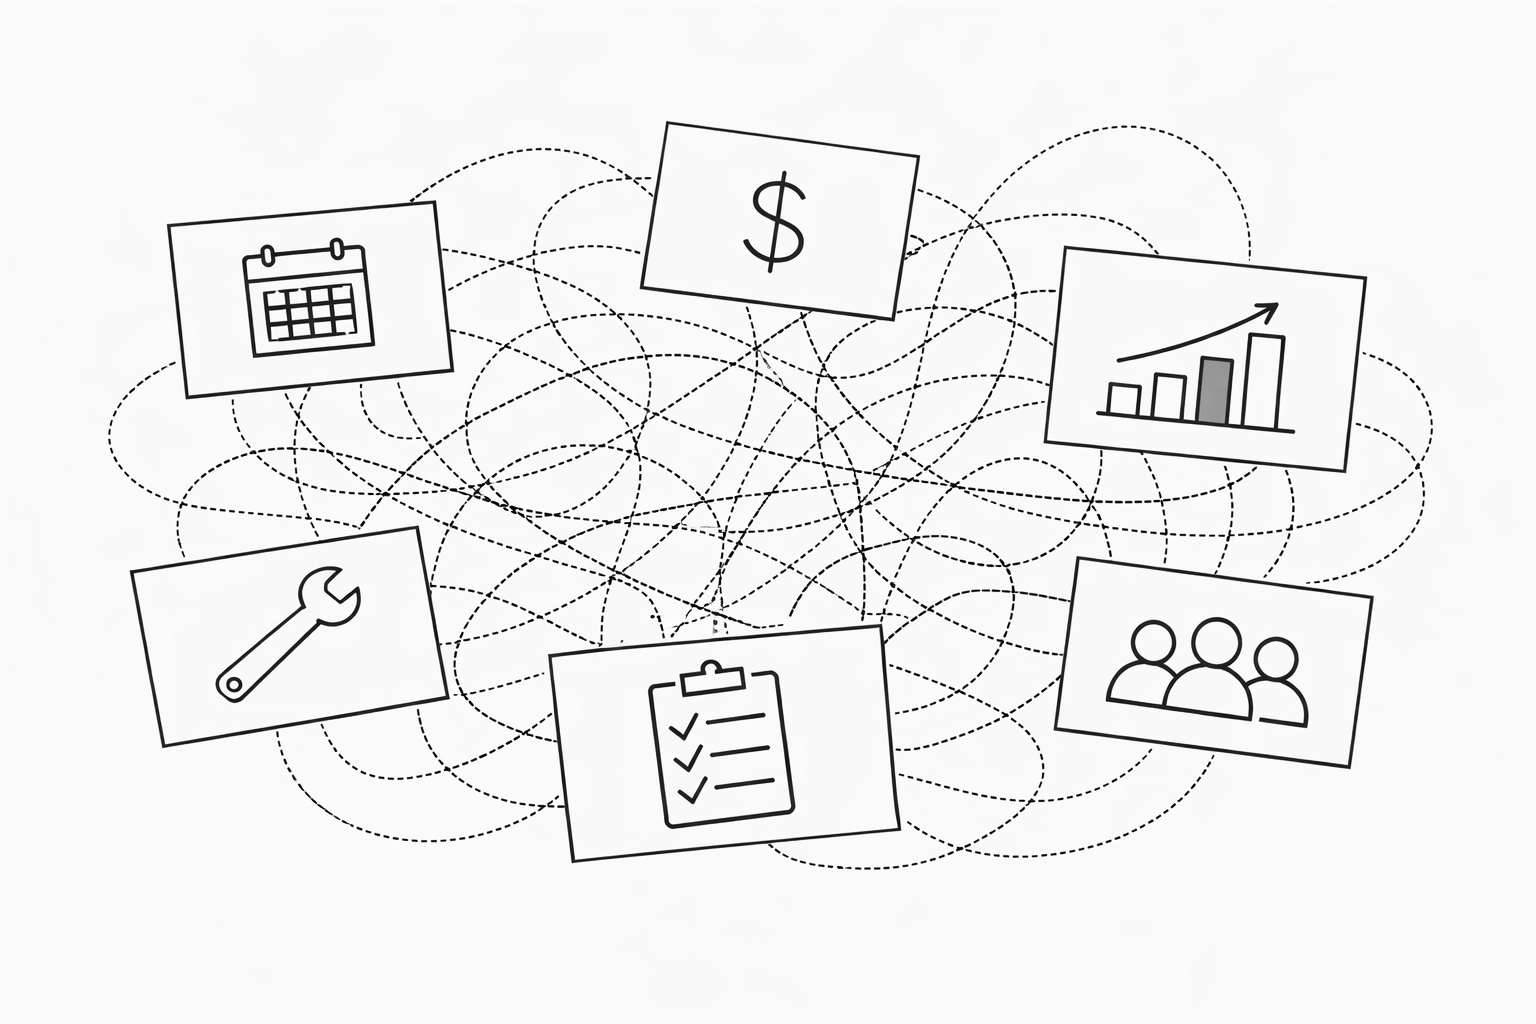
You've got ServiceTitan for dispatch. QuickBooks for accounting. A separate CRM for leads. Maybe a spreadsheet for tracking technician performance. Another tool for inventory. And something else for payroll.
Six tools. Six logins. Six different places to find the numbers you need to run your HVAC business.
And when it's time to figure out if last month was actually profitable? You're spending three hours pulling reports from each system, dumping them into Excel, and manually piecing together what happened. By the time you have answers, the month is already over.
There's a better way. And it doesn't require ripping out your entire tech stack.
The Hidden Cost of Tool Chaos
Most HVAC owners don't realize how much time and money they're losing to fragmented systems. You're not just wasting hours on manual reporting. You're making decisions with incomplete data.
When your dispatch data lives in one system and your job costs live in another, you can't see which jobs are actually profitable until after the fact. When your lead tracking is separate from your sales pipeline, you don't know which marketing channels are worth the investment. When technician performance metrics are scattered across three different tools, you can't identify coaching opportunities until problems become patterns.
The real problem isn't that you have multiple tools. Most successful HVAC companies do. The problem is that these tools don't talk to each other, and you're left playing data detective every time you need to make a decision.
This is where dashboard consulting comes in. Not to sell you another tool. But to connect the ones you already have.
What Good Dashboard Consulting Actually Looks Like
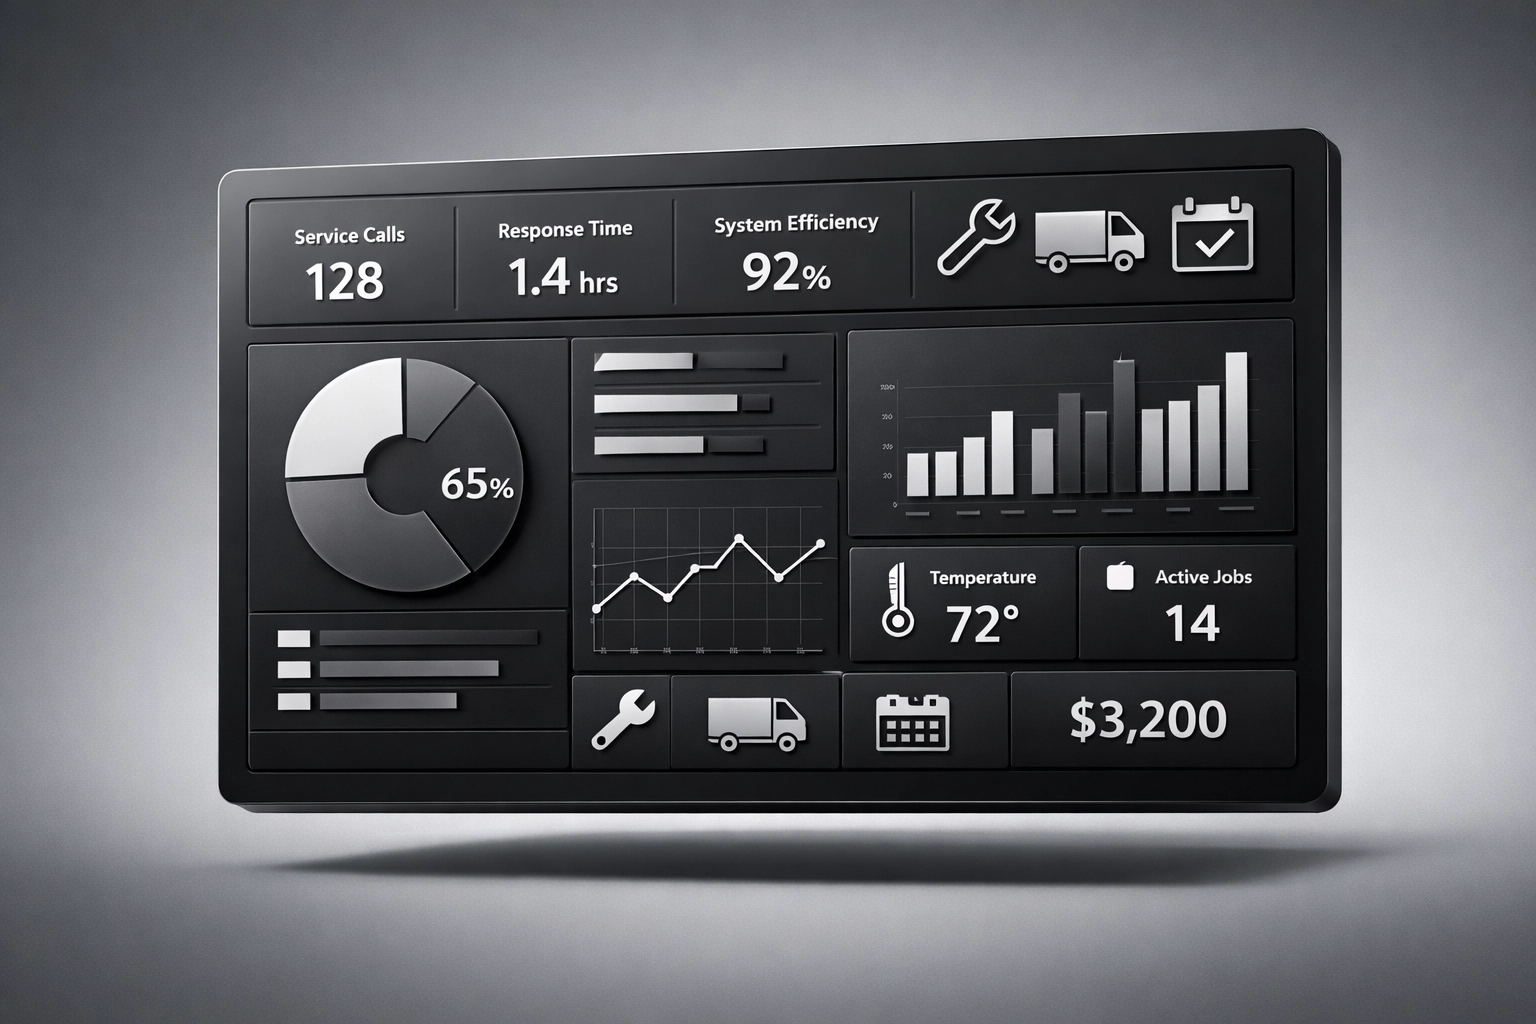
Dashboard consulting for HVAC isn't about fancy graphs or complicated software. It's about creating a single view of your business that pulls data from all your existing systems in real time.
Here's what that means practically:
Real-Time Data Integration
Instead of manually exporting reports from each tool, a properly configured dashboard automatically pulls data from ServiceTitan, QuickBooks, your CRM, and anywhere else your business data lives. Everything updates automatically. No manual work required.
Job-Level Profitability Visibility
You should be able to see exactly which jobs made money and which ones didn't. Not just revenue, but actual profit after labor costs, materials, drive time, and overhead. And you should be able to see this by job type, by technician, by service area, and by customer segment.
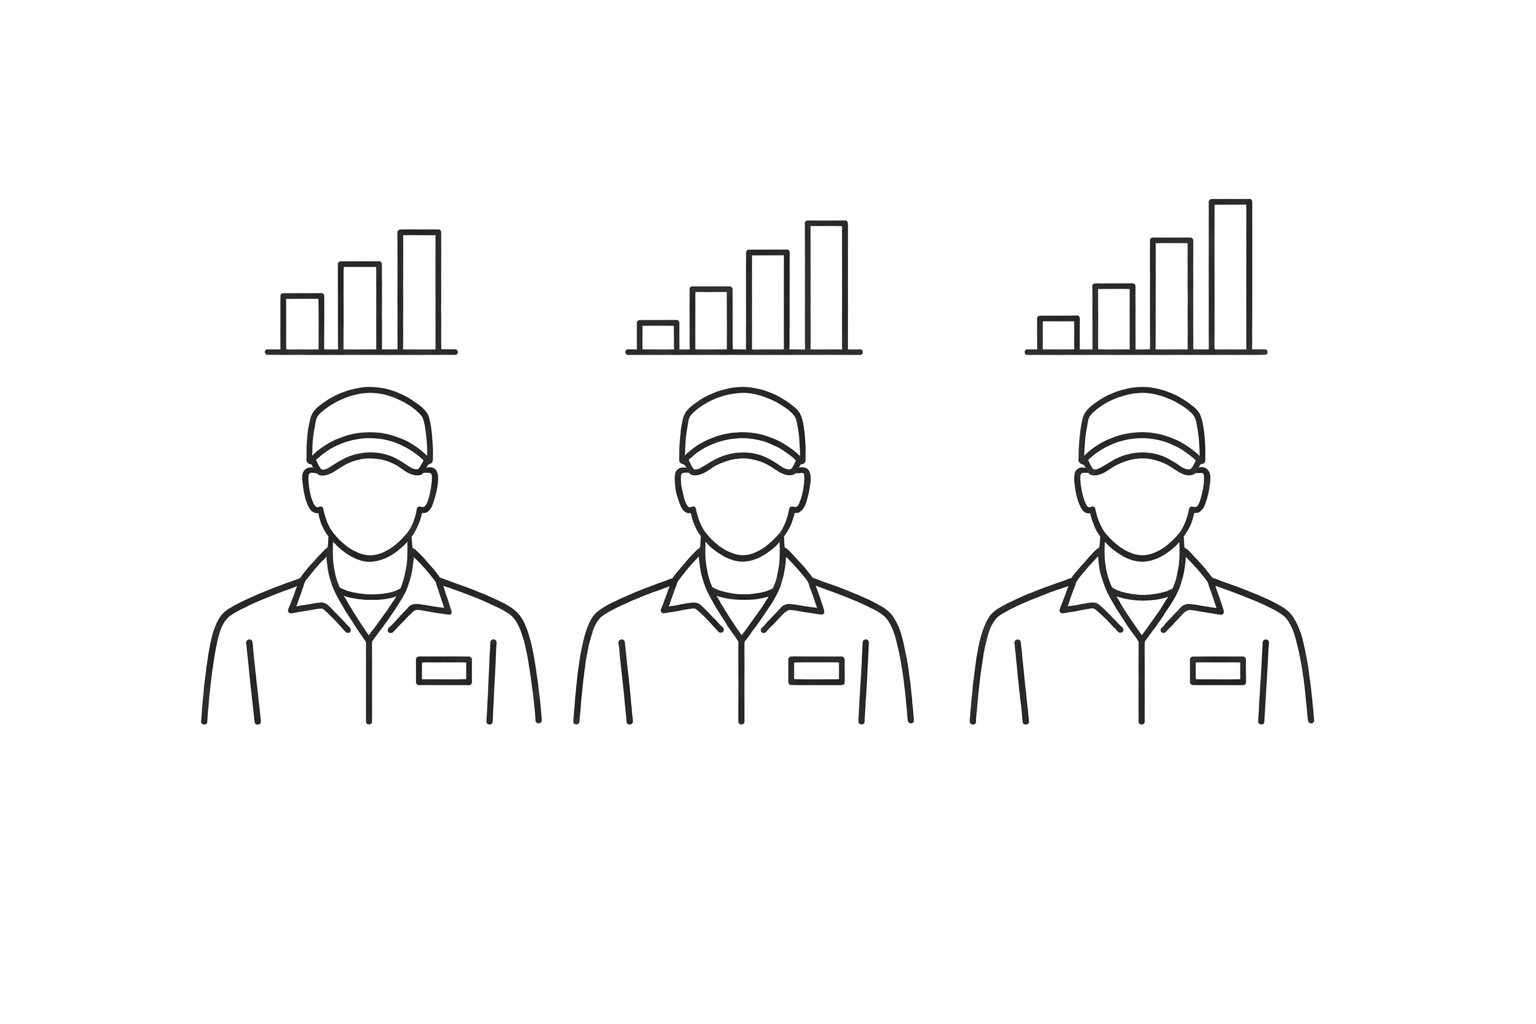
Technician Performance Tracking
Your dashboard should show you which technicians are closing the highest percentage of estimates, which ones have the best average ticket, and which ones consistently complete jobs under their estimated hours. This isn't about being punitive. It's about identifying your top performers so you can replicate what they're doing.
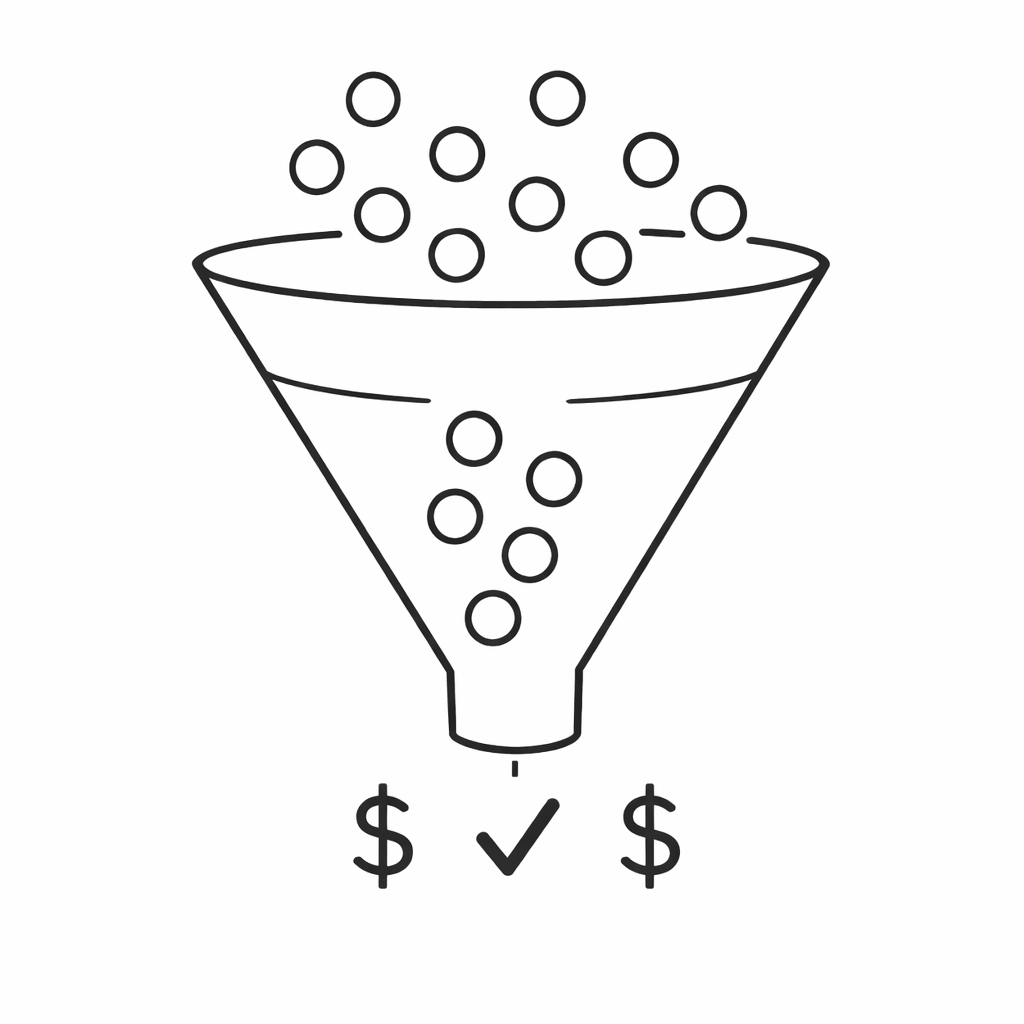
Lead Flow and Conversion Metrics
From the moment a lead comes in to the moment they become a customer, you should be able to track the entire journey. Which marketing channels generate the most leads? Which ones convert at the highest rate? Where are leads falling through the cracks? Your dashboard should answer these questions without requiring a data analyst.
Cash Flow and AR Aging
No more waiting until month-end to realize you're carrying too much accounts receivable. Your dashboard should show you current cash position, outstanding invoices, and aging reports in real time. So you can address collection issues before they become cash flow problems.
The Integration Advantage
The key to making this work is choosing the right integration approach. You have three main options:
Business Intelligence Platforms
Tools like Power BI, Tableau, or Plecto can connect to most HVAC software systems and pull data into customizable dashboards. These platforms are powerful but often require technical expertise to set up and maintain properly.
Custom Integration Solutions
For HVAC businesses with unique workflows or legacy systems, custom integrations using middleware platforms or APIs can connect disparate tools into a unified dashboard. This is more flexible but requires upfront development work.
Native Integration Ecosystems
Some HVAC software platforms like ServiceTitan offer native integrations with accounting systems, CRMs, and analytics tools. If your core systems already talk to each other, building a unified dashboard is much simpler.
The right approach depends on your current tech stack, your team's technical capabilities, and how customized your reporting needs are. This is where working with a consultant who understands both HVAC operations and systems integration makes a massive difference.
What Changes When You Can Actually See Your Numbers
Once you have a single dashboard that shows you everything you need to know about your HVAC business, the operational improvements happen fast.
Faster Decision Making
Instead of spending three hours every week pulling reports, you open one dashboard and immediately see what's working and what isn't. Should you hire another technician? The data shows you current capacity utilization. Should you raise prices on certain services? The data shows you which jobs have the thinnest margins.
Proactive Problem Solving
When you're not constantly looking backward at last month's numbers, you can start looking forward. You notice that one technician's average ticket has dropped 15% over the past two weeks. You can address it now instead of three months from now when it's become a pattern.
Better Resource Allocation
You see which service areas have the highest profit margins and can strategically focus marketing and scheduling in those zones. You identify which job types consistently run over estimate and can adjust pricing or processes accordingly.
Clearer Team Accountability
When everyone can see the same numbers, accountability improves naturally. Your dispatch team can see how their scheduling decisions impact technician utilization. Your technicians can see how their performance compares to the team average. Your CSRs can see which booking behaviors lead to the highest conversion rates.
The ROI Math Is Simple
Let's say you're currently spending five hours per week manually pulling reports and reconciling data across systems. That's 260 hours per year. If your time is worth $100 per hour (and as an owner, it probably should be), that's $26,000 in opportunity cost annually.
Now add the cost of decisions made with incomplete or outdated data. The jobs you're underpricing because you don't know your true costs. The technicians who are underperforming for months before you notice. The marketing channels you're overspending on because you can't track lead quality properly.
Most HVAC businesses that implement proper dashboard consulting see ROI within the first quarter. Not because dashboards magically make money appear. But because clarity drives better decisions, and better decisions drive profitability.
Moving from Reactive to Proactive
The biggest shift that happens when you consolidate your tools into one view isn't about efficiency. It's about mindset.
When you're spending all your time gathering data, you're always looking backward. You're reacting to what happened last week, last month, last quarter. When the data is already there, you start looking forward. You start asking better questions. Not "what happened?" but "what should we do next?"
This is the difference between running your HVAC business and letting it run you.
You've built a successful HVAC operation. Multiple trucks, good technicians, steady work. But your systems are holding you back from the next level of growth.
Before you spend another Saturday pulling reports from six different tools, talk to someone who can actually consolidate your view. At Sentric Group, we specialize in operations consulting for home services businesses. We connect your existing systems, build dashboards that actually get used, and help you see what's really happening in your business: without requiring you to switch software.
Ready to trade tool chaos for clarity? Let's start with a systems audit and show you what visibility looks like.